Signal craft
Readable traces before louder charts
We teach you to name spans, prune vanity metrics, and keep sampling policies that still catch rare stalls — without drowning on-call in pastel graphs that mean nothing.
Siheung studio · Korea
We turn noisy framework telemetry into calm, readable application analytics — so runtime diagnostics feel human again.
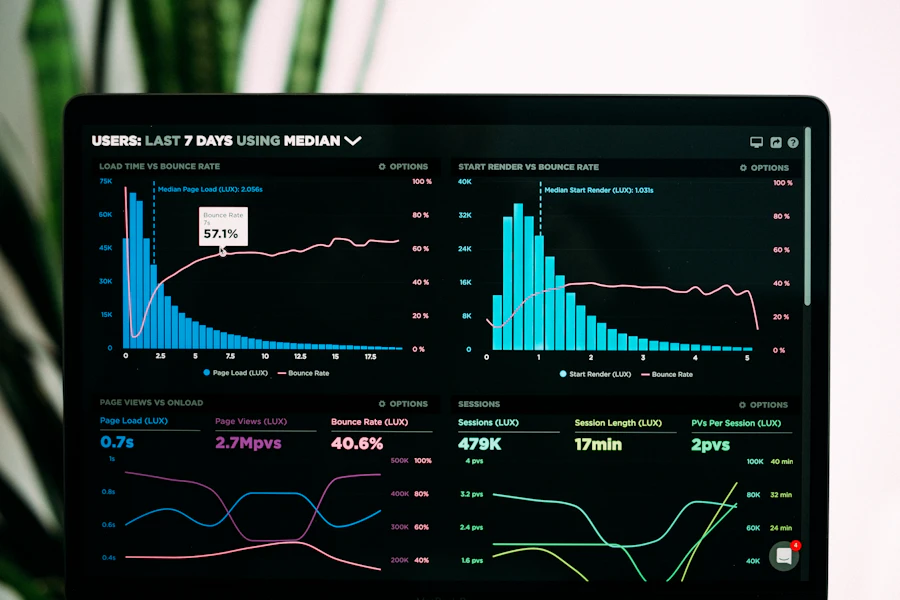
Why teams stay
Application analytics for framework runtime diagnostics should feel like a studio conversation, not a war room. We design lessons around warmth, clarity, and limits you can actually respect.
We teach you to name spans, prune vanity metrics, and keep sampling policies that still catch rare stalls — without drowning on-call in pastel graphs that mean nothing.
Bring a service you own. We work against its actual middleware, not a fictional shopping cart.
Evening clinics for Asia-Pacific teams, with recordings for distant collaborators.
If a symptom needs a debugger, we will not sell you another dashboard.
Social proof
“The Trace Companion module on span budgets made our Node gateway quieter overnight — though I still wish the homework included more Java examples.”
“Clearer than our vendor’s enablement deck. The sampling lab alone paid for the seat.”
Featured programs
A short shelf of programs built around application analytics for framework runtime diagnostics — each with its own visual mood and depth.

Map request journeys, choose sampling that respects rare failures, and build a calm diagnostic weekly ritual.
View course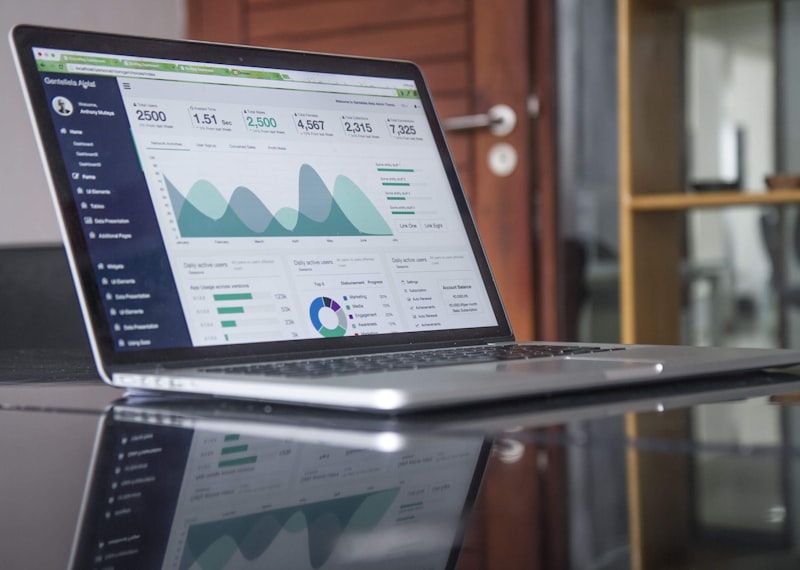
Reduce dashboard clutter and recover the few counters that actually explain runtime stalls.
See listing
Shared language for incident reviews, with pastel runbooks that stay useful under pressure.
See listingBook a gentle diagnostic conversation — no hard sell, just a clear read of where your signals go soft.
Talk with us Explore diagnostics